


Could you beat 9,999 random people at chess?
Using the Monte Carlo approach to tackle a fun little hypothetical challenge.

Last year, one of my roommates asked me: “If you were forced to beat 99 random strangers in a game of skill, where even one loss means instant death, what game would you choose to give you the best chance of survival?”
My answer was chess. I’m highly rated in Rapid (2087) and Classical (1827 USCF), and that’s amongst chess players. Against random strangers, I’d likely be in the 99.9th percentile. Additionally, I believe that the skill-based nature of chess makes it unlikely that a worse opponent will just ‘get lucky’ and beat me.
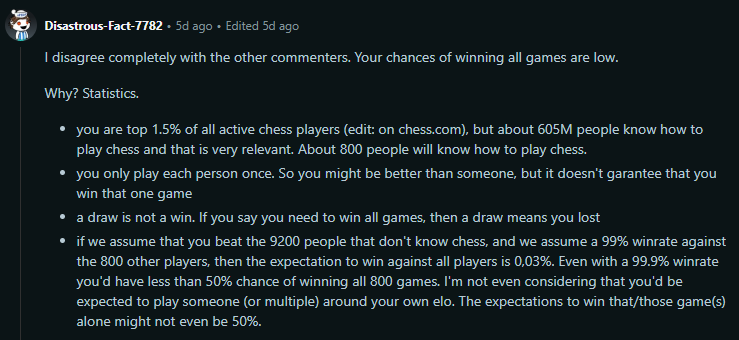
The other day I came across a similar discussion in r/theydidthemath. OP claimed they could beat not just 99, but 9,999 random people at chess. His friend thought he was full of shit. And the commenters were mixed:
I was torn between these two lines of reasoning. Were his odds of success reasonable, or were they astronomical? And I then realized…
I could simulate this whole scenario using the Elo system’s “Expected Score” metric to find out the answer.
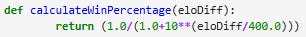
You see, Chess’s Elo rating system doubles as a predictor of game outcomes. Given two players’ respective ratings, you can predict the chance that player A will score a point against player B via the following formula:
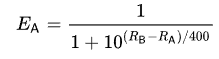
This is known as a logistic distribution function. The higher A is rated relative to B, the greater his chance of scoring a point is. However, his chances are never 100%, and a small chance of losing a match against an inferior opponent might compound over time.1
How much would his chance of a loss compound?
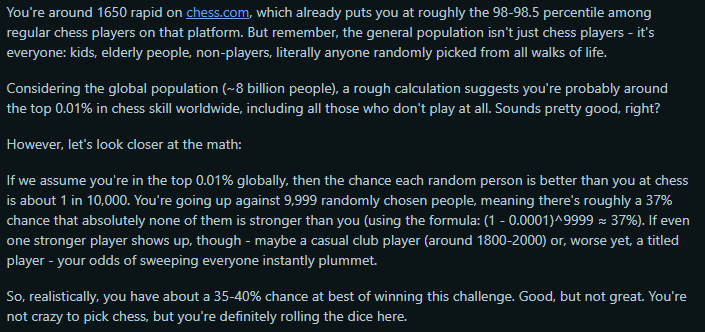
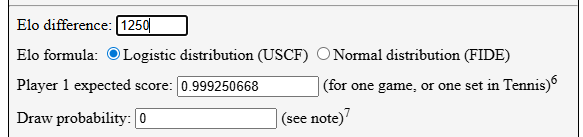
I found a cute little Elo win probability calculator which pegged the win % of a 1650-rated player vs a 400-rated player (chess.com’s recommended initial chess rating for complete beginners is 400) to be roughly 99.9%. Pretty good, right?
But what are his chances of beating 9,999 such “noobs” in a row?
Roughly 1/1800.
Already OP’s chances aren’t looking good. But I wasn’t satisfied. I wanted to do more than just a simple calculation: I wanted to use the Monte Carlo approach to find out exactly what his chances (and mine) of beating this gauntlet really are.
But what is the Monte Carlo Approach?
Sometimes the easiest way to estimate complex probabilities is to just simulate the event many, many times and see how it pans out. Computer scientists adopted the term Monte Carlo to describe this tactic, after the famous casino in Monaco. So long as you can define a problem sufficiently, and you have a powerful enough computer to simulate it millions of times, you can gain real insights into it with this approach.
Here was the plan:
Create a “population” of Elo ratings which corresponded to the real-world Elo distribution.
Sample 9,999 opponents from that population at random.
Use the expected score formula to determine the % chance of the player winning a match against each opponent. By multiplying all of these probabilities together, I’d get our intrepid hero’s expected chance of winning against all 9,999 opponents in a row.
Part 1: Simulating the Global Population
I decided to use this chart detailing the chess.com Rapid ratings distribution in 2023 to create my simulated chess population.
")
The plan was simple. Generate 1 hypothetical “player” for every thousand players present in each ratings bracket, with an Elo chosen randomly from within said ratings bracket. These players would collectively represent our global chess-playing population, which according to this PDF is around 605 million people..
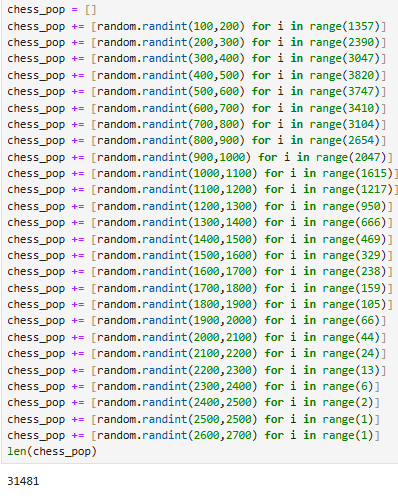
Notably, there are less than 1,000 players with Elo ratings in the 2500+ ratings brackets. To represent these players, I created a single “super-gm” with an Elo in between 2600 and 2700, as creating less than one player was impossible.
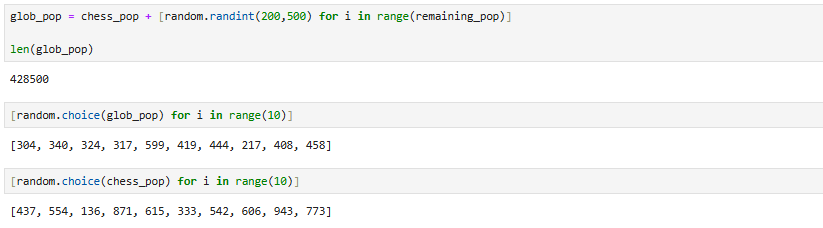
Next, we needed to include the rest of humanity.
I used this fancy website called World-o-meters to estimate earth’s current population:
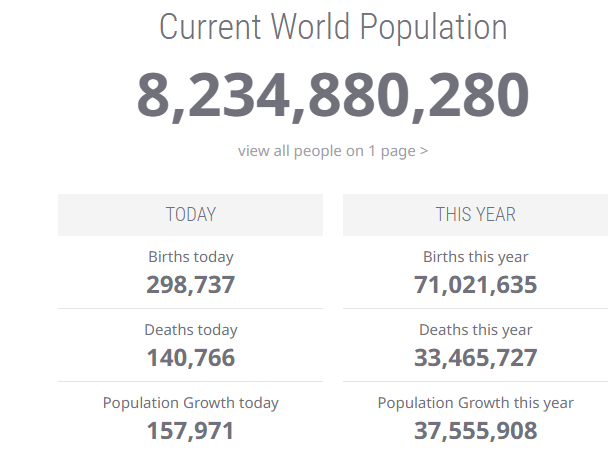
Our total simulated population should be of size P, where the ratio of our simulated chess_pop (31,481) to the real global chess-playing population (605,000,000) should be the same as P/Earth’s Population. So…
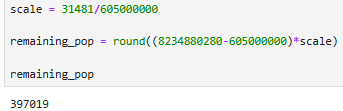
So we’ll create 397,019 noobs to add to our chess-playing population:
Now we just have to create the function for determining win % from relative Elo rating:
and we have all of the pieces in place to run this simulation2.
Simulating the Gauntlet
I first created a few functions to simulate playing a series of randomly generated opponents
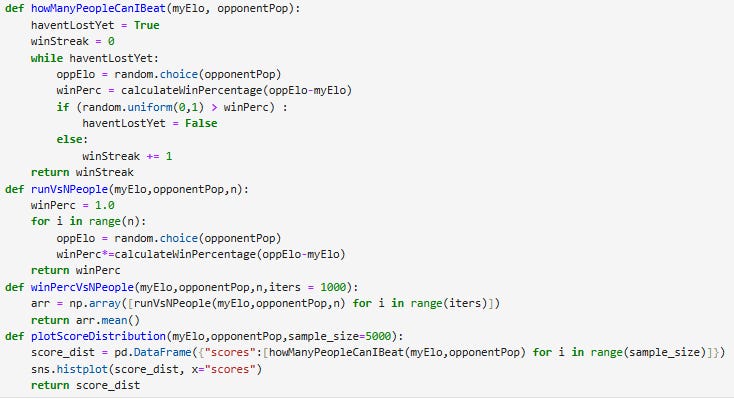
howManyPeopleCanIBeat(myElo, opponentPop) runs the gauntlet for player A of rating myElo against opponents sampled randomly from population opponentPop. Each game, we calculate A’s win probability p, then sample a random number n between 0 and 1. If n > p, A lost, and the gauntlet ends. Otherwise, A racks up 1 win and plays again. We keep going until A loses, and return A’s win count.
runVsNPeople(myElo,opponentPop,n) calculates the expected chance of player A with rating myElo to win against n players sampled from opponentPop in a row. We do this by multiplying the win probability of each match together to create a cumulative win probability.
plotScoreDistribution and winPercVsNPeople are aggregator functions for howManyPeopleCanIBeat and runVsNPeople respectively. plotScoreDistribution additionally returns a histogram of runs by win-streak size.
Can OP Beat 9,999 Random People?
Without further ado, we can use winPercVsNPeople to calculate OP’s probability of beating 9,999 randomly selected people to be…
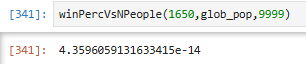
Oof. For those of you who haven’t used a TI-85, that’s a probability of about 0.00000000000436%. So it looks like the posts indicating OP’s chances were “near-zero” had the right of it.
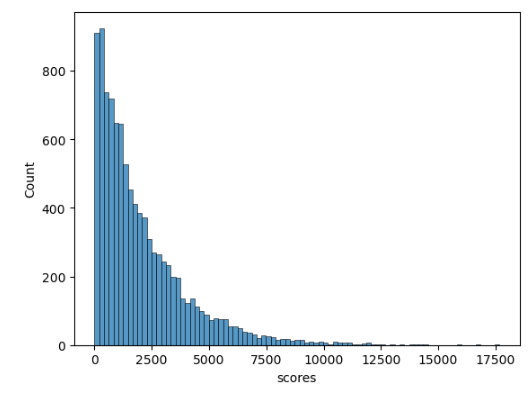
Here’s a histogram of 10,000 simulated runs for OP using plotScoreDistributions3.
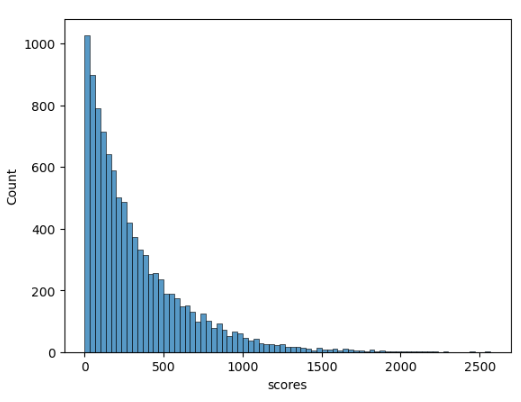
OP performed admirably, making it through 100 opponents in over half of his runs. But he only made it past 1,000 in a few. In his best run out of 10,000, he made it past slightly more than 2,500 opponents.
Ok, I have to know. How would I do?
I’m rated 2087 in Rapid, which should give me better odds of beating this gauntlet. But just how much better?

~0.66%! I’m in the percentage ball-park, wild!
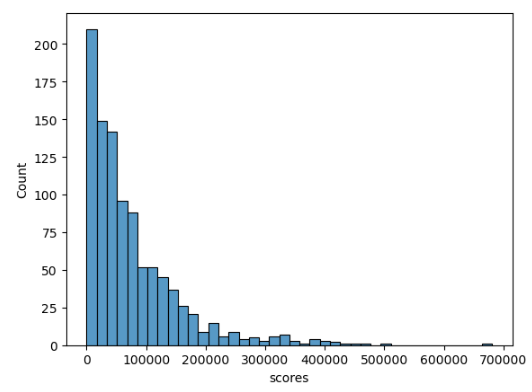
Here’s the breakdown of 10,000 simulated runs:
But we’re not done yet. I want to see a player beat this challenge. Magnus Carlsen is currently ranked #1 on chess.com’s Rapid Chess leaderboard, at a rating of 2819. What if he faced off against 9,999 random people?
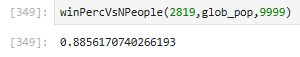
Alright, we finally have a player who’s favored against 9,999 random opponents. However, Magnus’s score still isn’t perfect. According to the Elo system, he has a ~11.5% chance of losing to at least one player before beating the gauntlet.
When the model conflicts with intuition, do we trust the model?
This is a really interesting result for me, because it fails my personal sanity check.
According to the Elo system, the miniscule yet ever-present chance of an upset compounds match after match, so that after 9,999 matches, even the world #1 stands a real chance of losing at least one opponent. But intuitively, I believe that Magnus would have no trouble crushing 9,999 random people in a row in chess. My personal experience, both playing and watching high-level play, insists that the Elo model must be over-representing the chance of an upset. Which viewpoint is correct, the model or my intuition? I really don’t know.
That’s the trouble with statistics. It’s an attempt to make sense of an imperfect world, with imperfect information. We can never truly say that a model is correct or accurate to reality, only that it is useful, or accurate to an extent. But it’s precisely this embrace of imperfection that draws me to statistics. Much like the Monte Carlo approach in computer science, statistics can be used to attack problems which defy analytical solution, or logical explanation. That makes it both incredibly practical and incredibly beautiful. And invoking it to solve a problem can be incredibly fun.
If you have thoughts about how Magnus would fare against 9,999 random opponents (or how you would do), or if you have suggestions about things I should change in my methodology, or other simulations you’d like to see, let me know in the comments!
Well, that’s all for now, folks. Stay curious!
Okay, technically the Expected Score metric measures one’s expected average point-per-game total averaged across many games, and that means it includes the possibility of draws (which in chess are worth 1/2 a point). But in this simulation, I’ve decided to treat it as a win percentage metric. If you don’t agree with it, I understand, but that’s tough. I’ve yet to find an alternative metric for calculating win % from player Elo in Chess, and many other online resources use the Expected Score metric as a way to calculate win %. See the Elo Win Probability Calculator;.
Note that this function returns a small win % for a positive eloDiff value, and a large win % for a negative one. This means that in the future we’ll have to calculate eloDiff from oppElo-myElo. I could have avoided this unintuitive behavior by using -eloDiff in the expression, but I prefer to keep the expression clean and get creative in the wrapper functions.
Just to clarify on how this chart is made. Each “run” consists of OP playing games against random opponents drawn from glob_pop until he incurs his first loss. Each run returns a score reflecting the number of opponents he beat before losing. For this chart, we simulate 10,000 ‘runs’, then plot the scores associated with each run in a histogram.